REPORTING
EXTENSIVE REPORTING AND ANALYSIS FEATURES
ENTERPRISE LEVEL REPORTING TOOLS TO MANAGE PROGRESS
A critical part of any business is the ability to easily access and report on data in your system. To address these needs, Trak360 has two reporting tools build in. Standard Reports supply the templates you need to complete routine reporting tasks. The Ad-Hoc tool allows advanced users to generate on-the-fly reports, exports, and charts.
STANDARD REPORTS
The standard reporting system in Trak360 provides over 300 built-in report templates organized by Module and Category. These reports are developed using Crystal Reports which provides an interface supporting complex queries and output operations.
Trak360 also supports the creation of custom reports and organizes them in their own column within the reporting interface.
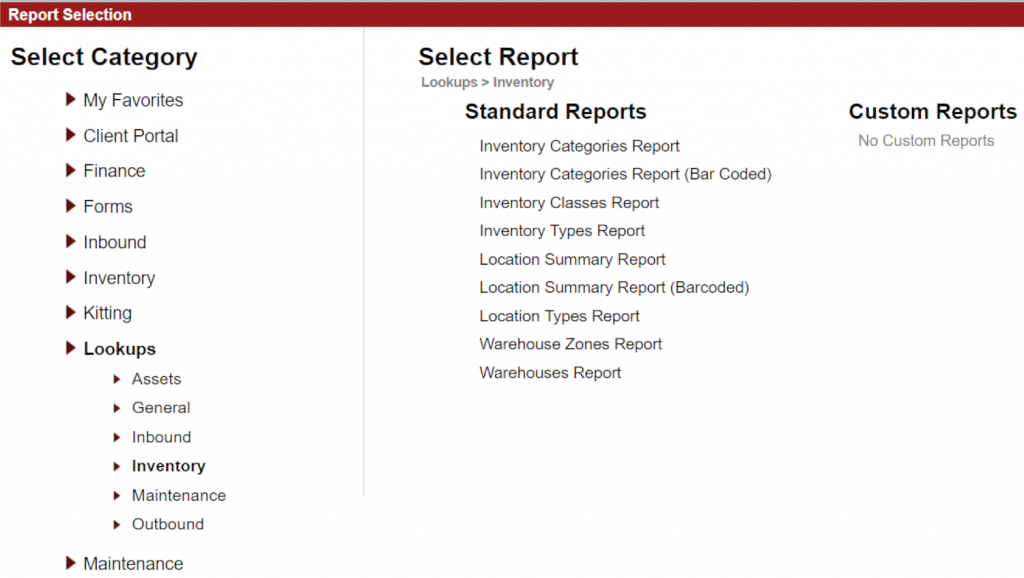
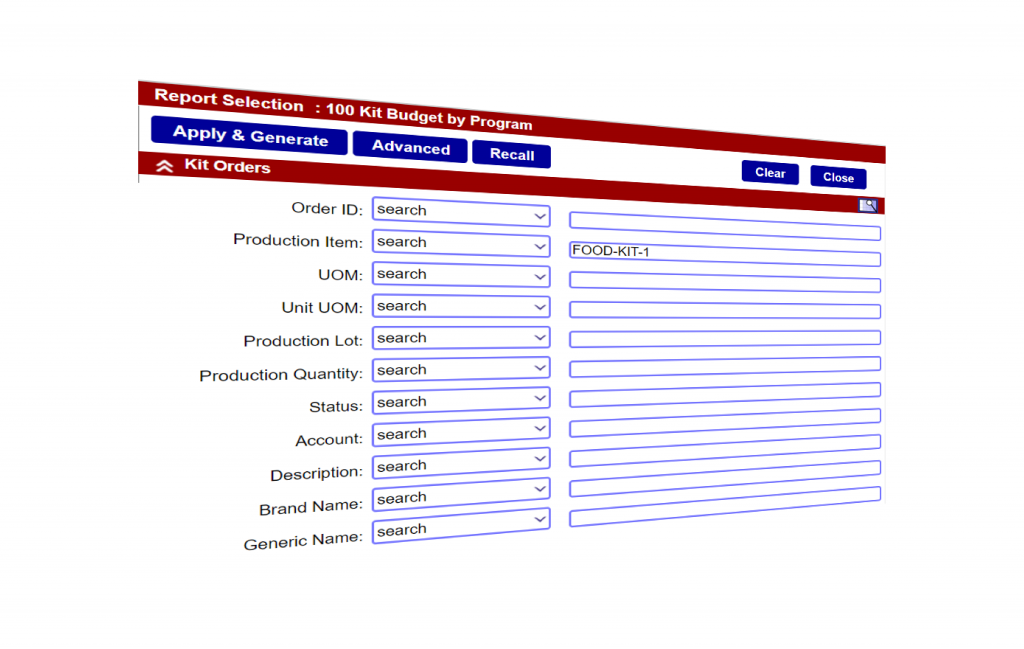
Users can submit queries on any report filtered by any of the fields associated with the tables that report references. This gives a powerful and flexible data selection capability. Report queries can be saved and retrieved for future use. Advanced users can also edit the native Crystal Reports query language to make advanced query requests.
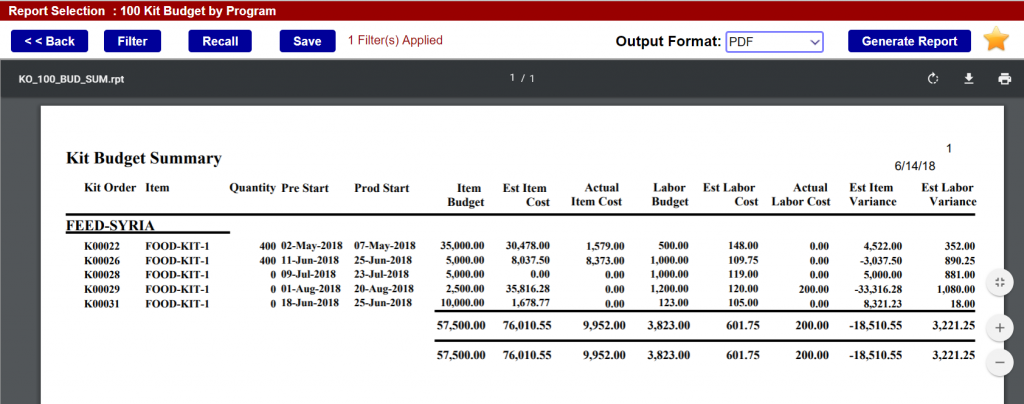
By default, reports are generated as PDFs. Entries are automatically uploaded and organized for convenient presentation. The output can be printed and exported to email for easy distribution. Like any PDF, the output can be scaled and zoomed. Report output can also be generated for Microsoft Excel.
AD-HOC REPORTS
To meet the needs of advanced users, Trak360 includes an Ad-Hoc reporting and data export tool. This tool allows a user to pull data from any combination of data tables in the system, query them in any way, and aggregate and chart the resulting data.
The process starts with selecting the table(s) you would like to pull data from. From here you can select any number of columns in your tables(s) and then move on to the filter process.
Similar to Standard Reports, the Ad-Hoc reporting system lets you filter by any combination of data fields in your selected tables – even if the field is not in your output! This allows users to generate very specific datasets for nearly any purpose.
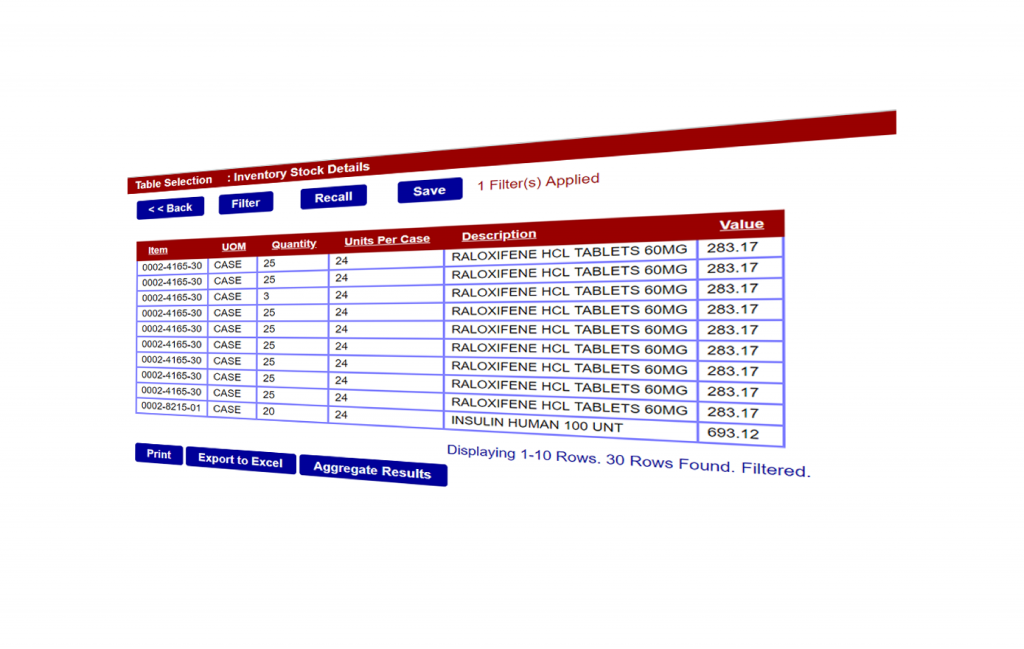
With the dataset preview at your fingertips, you now have several options. You can export the dataset to Excel, you can print the results, or you can fine-tune the data further by aggregating the results.
Aggregation allows you to take your resulting data set and choose sub columns to report on, group, and sort. This allows you to easily build meaningful summaries, groups, and pivots of your data.
Aggregation produces its own result set that you can again export to Excel, print, and use to generate charts.
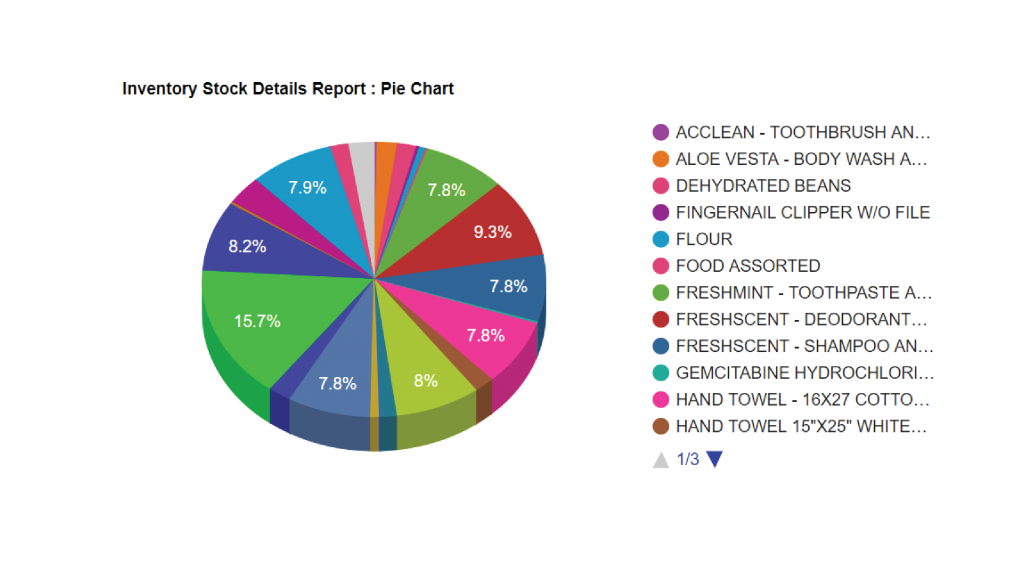
The charting function can be used to produce informative and versatile data graphics. The charts can easily be exported, saved, or emailed – making it easy to share your charts, or import them into your reports and presentations.
